
Anti-social behaviour reports in central Horsham rose from 315 to 545 between March and August as other crime fell 8%. The jump shows up across Sussex too.
Reports of anti-social behaviour in central Horsham have risen by almost three quarters in a year. Most other crime in the same area has fallen.
Police logged 545 anti-social behaviour reports within a mile of the town centre between March and August 2026. In the same six months of 2025 there were 315. That is a rise of 73%.
Over the same period, every other type of crime recorded in that circle fell from 1,251 to 1,149, down 8%.
The figures come from the Home Office’s street-level crime data, which every force publishes monthly on police.uk. We counted every record placed within one mile of central Horsham for each month from September 2024 to August 2026. August 2026 is the latest month released.
When it started
The rise did not build slowly. It arrived as a step in February 2026.
- January 2026: 30 reports
- February 2026: 59 reports
- July 2026: 110 reports, the highest month in the two years we checked
- August 2026: 96 reports
For comparison, the busiest month in the previous twelve was May 2025, with 63.
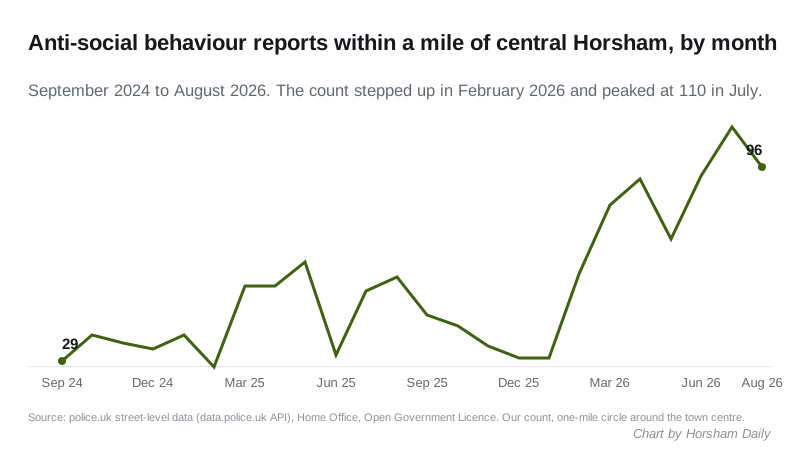
Over a full year the picture is the same. September 2025 to August 2026 brought 784 reports, against 515 in the twelve months before: up 52%.
Other crime is flat or falling
The rise is confined to anti-social behaviour. March to August, 2025 against 2026, within the same one-mile circle:
| Type | Mar to Aug 2025 | Mar to Aug 2026 |
|---|---|---|
| Anti-social behaviour | 315 | 545 |
| Violence and sexual offences | 440 | 420 |
| Shoplifting | 326 | 310 |
| Public order | 115 | 96 |
| Criminal damage and arson | 113 | 104 |
| Other theft | 71 | 67 |
| Burglary | 47 | 41 |
| Drugs | 35 | 23 |
| Robbery | 24 | 20 |
| Vehicle crime | 21 | 22 |
Shoplifting is down 5%, and violence and sexual offences are down by about the same.
It is not just Horsham
We ran the same count for other towns, using the same one-mile circle and the same months. The jump appears right across Sussex:
- Worthing town centre: 523 to 839, up 60%
- Crawley town centre: 475 to 729, up 53%
- Chichester city centre: 551 to 687, up 25%
- Horsham, within five miles, taking in Southwater, Broadbridge Heath and Warnham: 615 to 948, up 54%
Across the border in Surrey, the picture is mixed. Guildford town centre fell from 342 to 318. Reigate rose from 89 to 118.
A rise that starts in the same month across a whole force area can mean more trouble on the streets. It can also mean a change in how calls are logged or categorised. Sussex Police has not published an explanation that we can find, so we cannot tell you which it is.
Where reports are mapped
Police.uk does not publish exact addresses. Each report is moved to the nearest of a set of anonymous map points, some of which are labelled only “Parking Area” or “Supermarket”. The busiest points in central Horsham, March to August 2026:
- on or near Black Horse Way: 61 reports, up from 26
- on or near a “Parking Area” point: 44, up from 27
- on or near a “Supermarket” point: 29, up from 9
- on or near Arthur Road: 23, up from 9
- on or near a “Theatre/concert hall” point: 18
These are points on a map, not the places where incidents necessarily happened.
What the police say they are doing
Anti-social behaviour is listed as a priority by both neighbourhood teams covering the town centre, in priorities updated on 1 October (Horsham Park and Trafalgar, priorities data).
The Horsham Park and Trafalgar team says it will:
- carry out visible foot patrols in hot spots “such as West Street and The Forum”
- engage with young people responsible for anti-social behaviour
- park a marked vehicle in town as a deterrent
The Denne and Forest team lists anti-social behaviour alongside drug activity and dangerous e-bike riding, “especially on New Street, Bennetts Field” (priorities data). The Horsham Park and Trafalgar team’s other priorities are retail crime and cycling on pavements.
These figures add a local view to the district-wide picture published last month. Horsham District Council’s annual crime update recorded a 20% rise in anti-social behaviour across the district in 2025, while total crime fell (our report).
What it means for you
- Report it. Neighbourhood teams decide where to patrol partly from where reports come in. Anti-social behaviour can be reported online through Sussex Police or by calling 101. Call 999 if someone is in danger or a crime is happening now.
- Check your own street. The police.uk map shows the latest month for any postcode, and its neighbourhood pages list local priorities and meetings.
- Read the numbers carefully. A report is a call logged by the police, not a confirmed incident or a crime. Until Sussex Police explains the force-wide jump, treat the size of the rise with some caution.
About these figures
- We counted records in police.uk’s street-level data within a one-mile (1,609m) circle centred on the middle of Horsham, using the data.police.uk API, month by month. The comparison towns used the same method around their own centres.
- Police.uk’s own one-mile figure for central Horsham in August 2026 is 284 records of all types. Our count for the same month is 283, a difference caused by the shape of the circle.
- Anti-social behaviour is recorded as a separate category from crime. “Other crime” in this story means every category except anti-social behaviour.
- Data is published under the Open Government Licence.
Have your say