
The average Horsham district home sold for £436,940 in June 2026, down 0.2% in a year. Prices by type, the £1m+ streets, and how Horsham compares to Sussex.
The average home in the Horsham district sold for £436,940 in June 2026, down 0.2% on a year earlier. Asking prices in agents’ windows tell you what sellers hope for; the figures on this page are what homes actually changed hands for, recorded by HM Land Registry once each sale completes and published as the UK House Price Index. Horsham remains the dearest of the seven district and borough areas in West Sussex, but it is no longer rising. Here is the full picture, each figure linked to its source.
The headline figure
The £436,940 district average for June 2026 is the provisional figure from the official UK House Price Index, built from completed Land Registry sales across the whole local authority: Horsham town, Billingshurst, Southwater, Storrington, Pulborough, Steyning, Henfield and the villages between.
Three things stand out in the latest data:
- Prices fell 0.2% over the twelve months to June 2026, and 0.4% on May alone. The annual rate has slid steadily through the year, from +4.3% in January to below zero in June.
- The middle of the market is holding up. Semi-detached homes rose 1.0% and terraces 1.1% over the year, while detached fell 1.0% and flats fell 1.8%. If you own a semi or a terrace, your year beat the headline; a detached house or a flat did worse.
- Fewer homes are changing hands. The index records 145 district sales in January, 125 in February, 152 in March and 102 in April, the thinnest month of the year so far; May and June counts are not published yet because sales register late. A thinner market means individual streets’ averages jump around more than usual.
One caveat worth carrying: UKHPI figures are provisional and get revised as late-registered sales arrive, so treat the precise pounds as an estimate that will settle over the next few months.
What you pay by property type
These are the June 2026 averages from the UK House Price Index for Horsham, with the change over the year:
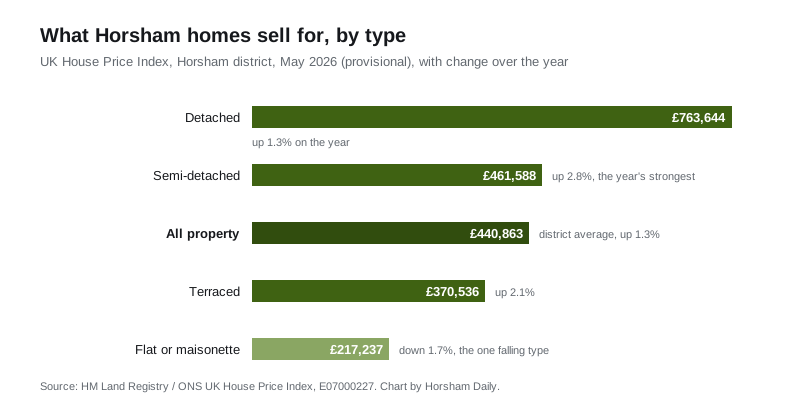
- Detached houses: £755,971, down 1.0% on the year. The district’s signature stock, from the big plots off Worthing Road to village houses around Storrington and Steyning.
- Semi-detached houses: £457,337, up 1.0%, and sitting just above the district average.
- Terraced houses: £368,181, up 1.1%, the strongest performer of the year. The realistic first house for most buyers moving up from a flat.
- Flats and maisonettes: £215,213, down 1.8%, the weakest of the four. Flat buyers are the most exposed to mortgage costs, and demand has tilted back toward houses with gardens.
A first-time buyer in the district paid an average of £320,765 in June 2026, effectively flat on the year at plus 0.1%. A home mover, someone selling one home to buy another, paid £551,106, down 0.4%. The £230,000 gap between those two figures is the size of the step from a first flat or terrace to a family house in this part of Sussex. Cash buyers paid more on average (£461,780) than mortgage buyers (£425,184), which usually reflects cash being concentrated at the top of the market.
The £1 million streets
Based on sold-price records compiled by PropertySolvers from Land Registry data, the most expensive streets in Horsham town cluster on the western and southern edges, where plots are biggest:
- Rookwood Park, off Warnham Road, averages about £1.48 million across recent sales.
- Wildgoose Drive (£1.33 million), Guildford Road (£1.15 million) and Worthing Road (£1.14 million) follow.
- The Causeway, the historic street by the parish church, averages about £1.04 million, proof that period character prices like acreage in this town.
At the other end, the cheapest averages are retirement and flat developments such as Chesterton Court at Manor Fields and Homestream House on Mill Bay Lane, both under £130,000, which is a reminder that “average” spans two very different markets.
For the town rather than the district, Rightmove’s sold-price records put Horsham’s overall average at £427,252 for the last year, with flats the most-sold type at £241,805. That figure sits below the district average because the town sells far more flats than the villages do; the district-wide index mixes in the detached villages and comes out higher. Both are real, they just measure different mixes, so always check what area and property mix a figure covers before comparing.
How Horsham compares to its neighbours
| Area | Average price | Change in a year |
|---|---|---|
| Horsham district | £436,940 | -0.2% |
| West Sussex | £372,660 | 0.0% |
| South East region | £380,380 | +0.3% |
| England | £293,262 | +1.8% |
The average Horsham district home costs roughly £64,000 more than the typical West Sussex home and about £144,000 more than the England average. The pull is familiar: direct trains to London Bridge and Victoria, good schools, and countryside on three sides. Affordability is the flip side; Plumplot puts the district’s house-price-to-earnings ratio at 10.3, among the higher figures in the county (Plumplot). Where the next decade’s supply comes from is the subject of the district’s Local Plan and the 3,000-home West of Ifield scheme, covered on our Horsham planning news page.
What it means for you
If you are buying, the softest corners of the market are flats, down 1.8% in a year, and detached houses, down 1.0%, so that is where negotiating room lives; check the council tax band of anything you view, since that bill is a running cost buyers overlook while fixed on the asking price. If you are selling, semis and terraces are the only two types that gained over the year, and realistic pricing matters more now that April recorded just 102 district sales. If you are staying put, your home is worth fractionally less than a year ago, which after the sharp rises of 2021 and 2022 is what a flat market looks like.
Frequently asked questions
What is the average house price in Horsham?
£436,940 in June 2026 across the Horsham district, per the UK House Price Index, built from completed Land Registry sales. Horsham town alone averages a little less (£427,252 on Rightmove’s last-year figures) because the town sells more flats than the villages.
Are Horsham house prices going up or down?
Slightly down. The district average fell 0.2% in the year to June 2026, having been up 4.3% in January. Terraces (+1.1%) and semi-detached houses (+1.0%) gained; detached fell 1.0% and flats 1.8%.
How much is a detached house in Horsham?
A detached house averaged £755,971 in June 2026, about £299,000 more than a semi and roughly double a terrace.
Where are the most expensive streets in Horsham?
Sold-price records put Rookwood Park top at about £1.48 million, followed by Wildgoose Drive, Guildford Road, Worthing Road and The Causeway (PropertySolvers).
Is Horsham more expensive than the rest of West Sussex?
Yes, and it is the dearest of the county’s seven district and borough areas. The district average of £436,940 is about £64,000 above the West Sussex average of £372,660, and above the South East average too.
Where can I check what a specific house sold for?
Every completed sale in England and Wales is public. Look up any street or address free on the HM Land Registry Price Paid service, or browse the same data on Rightmove and Zoopla.
Sources
- UK House Price Index, Horsham, June 2026 provisional figures (HM Land Registry), including property types and buyer status, plus the same series for West Sussex, the South East and England
- PropertySolvers: Horsham house prices and most expensive streets (street averages, town sales counts)
- Plumplot: West Sussex house prices (county sales volumes, price-to-earnings ratios)
- Rightmove: Horsham sold prices (town-level last-year averages)
- HM Land Registry Price Paid search (check any individual address)
Figures are provisional and revised as late sales register: May 2026 was first published at £440,863 and now reads £438,898. Land Registry figures updated to the June 2026 release on 21 August 2026; street-level and third-party figures last checked 7 August 2026.
Have your say