
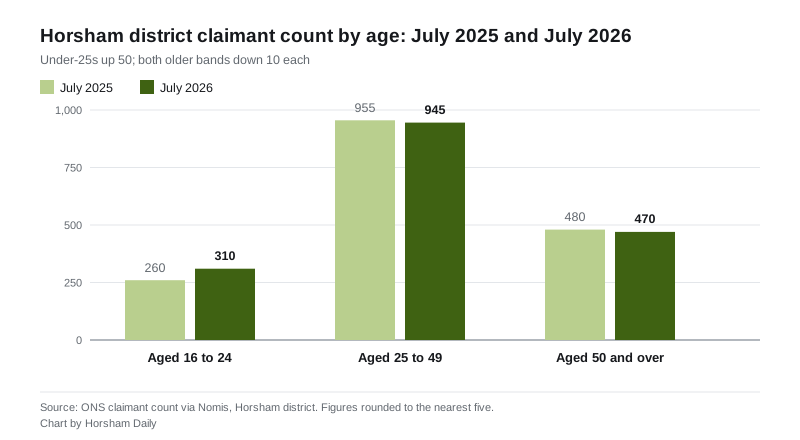
1,725 people in Horsham district claimed unemployment benefits in July, up 30 on the year. Every bit of that rise came from under-25s: 260 to 310.
The number of under-25s claiming unemployment-related benefits in the Horsham district rose from 260 to 310 over the year to July, a rise of about 19 per cent. Across the same twelve months the district’s total count went up by only 30, from 1,695 to 1,725, because claims by everyone over 25 fell (ONS claimant count via Nomis, retrieved 25 August 2026).
In other words, the headline is flat and the detail underneath it is not.
The claimant count covers people on Jobseeker’s Allowance plus Universal Credit claimants who have to look for work. It is not the full unemployment measure, but it is the only jobs figure published every month for the district, so it is the clearest regular reading of the local labour market.
The whole rise, and more, is young people
The three broad age bands moved in opposite directions between July 2025 and July 2026:
- aged 16 to 24: up from 260 to 310, a rise of 50
- aged 25 to 49: down from 955 to 945, a fall of 10
- aged 50 and over: down from 480 to 470, a fall of 10
Under-25s now make up 18.0 per cent of all claimants in the district, against 15.3 per cent a year ago.
Youth claims are rising nationally too, but not this fast. In the South East the 16 to 24 count went from 31,090 to 34,885 over the same year, a rise of about 12 per cent. Across the United Kingdom it went from 302,835 to 332,335, about 10 per cent. Horsham’s 19 per cent is steeper than both.
One caution on that comparison. The ONS rounds these figures to the nearest five, so on a base of 260 a single rounding step moves the percentage noticeably. The direction is solid; treat the exact percentage as approximate.
The district is still a long way below average
None of this changes how low unemployment is here in absolute terms. In July, 1.9 per cent of Horsham district residents aged 16 to 64 were claiming, against 3.1 per cent across the South East and 3.9 per cent for the United Kingdom. That is roughly one working-age resident in 53 here, against one in 26 nationally.
Of July’s 1,725 claimants, 920 were men and 805 were women.
There is also a correction to make to our own reporting. When we covered the June figures on 6 August, the published count for June was 1,730. The ONS has since revised June down to 1,705, so July’s 1,725 is a rise of 20 on the revised month, not a fall.
Where in the district
Ward figures for July 2026, ranked, with June for comparison:
| Ward | June 2026 | July 2026 |
|---|---|---|
| Denne | 190 | 200 |
| Billingshurst | 130 | 140 |
| Forest (Horsham) | 135 | 135 |
| Storrington & Washington | 115 | 115 |
| Colgate & Rusper | 100 | 105 |
| Pulborough, Coldwaltham & Amberley | 100 | 95 |
| Roffey South | 95 | 90 |
| Henfield | 65 | 80 |
| West Chiltington, Thakeham & Ashington | 70 | 75 |
| Broadbridge Heath | 80 | 70 |
| Roffey North | 75 | 70 |
| Southwater South & Shipley | 75 | 70 |
| Steyning & Ashurst | 70 | 70 |
| Holbrook West | 60 | 65 |
| Itchingfield, Slinfold & Warnham | 60 | 65 |
| Bramber, Upper Beeding & Woodmancote | 55 | 60 |
| Holbrook East | 55 | 55 |
| Trafalgar | 55 | 50 |
| Cowfold, Shermanbury & West Grinstead | 45 | 40 |
| Southwater North | 35 | 30 |
| Nuthurst & Lower Beeding | 20 | 20 |
| Rudgwick | 20 | 20 |
The biggest single monthly move was Henfield, up 15. Denne and Billingshurst each rose 10, and Broadbridge Heath fell 10. Rounding again explains the small gap between the ward column and the district figure: the wards sum to 1,720 against a district total of 1,725.
What it means for you
If you are 16 to 24 and looking for work here, more people are in the same position than a year ago. For older age groups the picture has eased slightly. That is the opposite of what the flat headline number suggests.
The main route into support is Universal Credit, claimed online. Households on a low income can also apply for Council Tax Reduction, which Horsham District Council administers. It cuts the bill itself rather than paying out cash. Our guide to council tax bands in Horsham explains how that bill is worked out in the first place.
The August figures are due from the ONS in mid-September. We will report them.
Have your say