
The average Horsham district home sold for £436,940 in June, dearer than anywhere in West Sussex. But annual growth has slid from 4.3% to below zero.
The average home in the Horsham district sold for £436,940 in June 2026, more than in any of the other six district and borough areas of West Sussex. That is the headline from HM Land Registry’s latest UK House Price Index (UKHPI, Horsham, June 2026).
Being top of the county table is the part that has not changed. What has changed is the direction. A year ago the same measure read £437,889. The district is now 0.2% down over twelve months, and 0.4% down on May alone.
Growth has gone from 4.3% to below zero in five months
This is the sharpest part of the picture, and it does not show up in a single month’s figure. Here is the annual rate of change for the district through 2026, from the same index:
- January: +4.3%
- February: +2.5%
- March: +1.8%
- April: -0.3%
- May: +0.8%
- June: -0.2%
Two of the last three months are negative. For comparison, England as a whole rose 1.8% in the year to June, and the South East 0.3% (UKHPI, England; South East). Horsham is not tracking the national market at the moment; it is lagging it.
Where Horsham sits in the county table
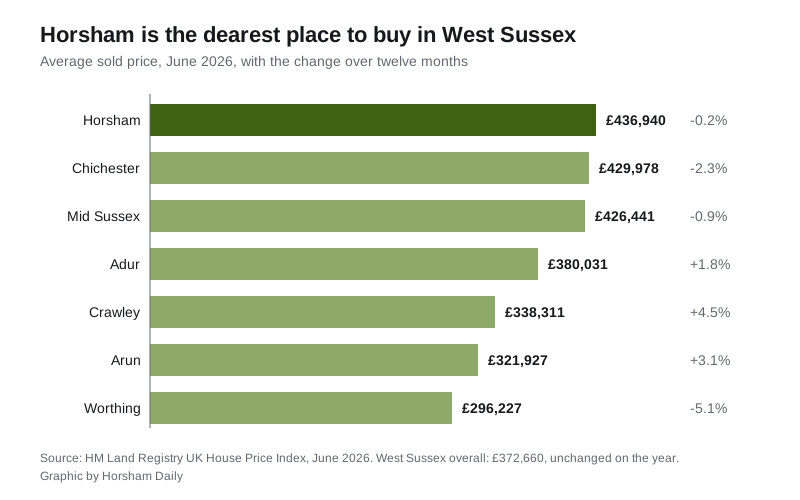
Average sold price in June 2026, with the change over twelve months:
- Horsham £436,940, down 0.2%
- Chichester £429,978, down 2.3%
- Mid Sussex £426,441, down 0.9%
- Adur £380,031, up 1.8%
- Crawley £338,311, up 4.5%
- Arun £321,927, up 3.1%
- Worthing £296,227, down 5.1%
West Sussex as a whole averaged £372,660, exactly level on the year. The three dearest areas, Horsham, Chichester and Mid Sussex, are all falling, while the two fastest risers, Crawley at 4.5% and Arun at 3.1%, are among the cheapest. Worthing breaks the pattern: it is the cheapest area in the county and it also fell the furthest.
Terraces up, detached and flats down
Within the district the averages pull in opposite directions:
- Detached: £755,971, down 1.0%
- Semi-detached: £457,337, up 1.0%
- Terraced: £368,181, up 1.1%
- Flats and maisonettes: £215,213, down 1.8%
So the middle of the market held its value over the year while the top and the bottom lost ground. Flats fell furthest. On the index itself, where every figure is measured against the same base, Horsham flats read 96.1 while every other property type in the district reads above 100.
A first-time buyer paid an average of £320,765, effectively flat on the year at plus 0.1%. Someone selling one home to buy another paid £551,106, down 0.4%. Cash buyers paid £461,780, mortgage buyers £425,184.
Two health warnings on these numbers
UKHPI is a mean, not a median. It is the arithmetic average of sold prices, so a handful of very expensive sales in a month pulls it upward. In a district with £1m-plus streets and sub-£130,000 retirement flats, that matters. It is not the price of a typical Horsham house; it is the average of what sold.
The recent months get revised. When we published our Horsham house prices guide on 8 August, the May figure was £440,863 and a 1.3% annual rise. That same month now reads £438,898 and 0.8%, because late-registered sales have since arrived. June’s £436,940 will move too. Treat the newest month as provisional and the trend as the real information.
Sales volumes carry the same lag, which is why the index has not yet published counts for May or June. The last four it does give are 145 sales in January, 125 in February, 152 in March and 102 in April, the thinnest month of the year so far. Fewer transactions make monthly averages jumpier.
What it means for you
If you are selling, the county-topping average is not a pricing signal. Detached homes and flats are the two types that lost value over the year, and April’s transaction count was the lowest of 2026, so expect a slower market rather than a strong one, and price against recent comparable sales rather than the district headline.
If you are buying, the district is no longer getting more expensive faster than your savings, which it was doing at 4.3% in January. Crawley and Arun, both within commuting distance, are still rising at 4.5% and 3.1%.
If you are checking your council tax band, the valuation behind it is from 1 April 1991, not today’s price, so none of this changes it. Our guide to Horsham council tax bands sets out the 2026/27 charges and how to challenge a band.
Longer-term, the supply side sits with the district’s Local Plan and the schemes going through the planning register. Full detail on prices by type, the district’s most expensive streets and how the town compares with the district is on our Horsham house prices page.
Sources
- UK House Price Index, Horsham district, June 2026, HM Land Registry
- UK House Price Index, West Sussex, June 2026, HM Land Registry
- District figures for Chichester, Mid Sussex, Adur, Crawley, Arun and Worthing, HM Land Registry
Have your say