
1,750 claimed in August, the sharpest monthly rise since February 2025. At 2.0 per cent Horsham is still the lowest rate in West Sussex; Crawley is 4.6.
The number of people claiming unemployment-related benefits in the Horsham district rose by 60 in August, to 1,750. That is the sharpest one-month rise since February 2025 (ONS claimant count via Nomis, retrieved 18 September 2026).
It is also the highest figure since March. On the year the rise is smaller: August 2025 was 1,715.
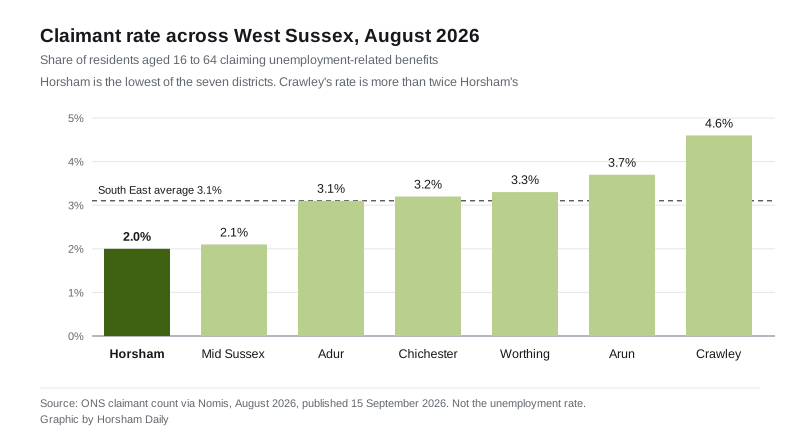
Set against the rest of the county, though, Horsham is still the easiest place in West Sussex to be in work. Its claimant rate is 2.0 per cent of residents aged 16 to 64. Crawley’s is 4.6, more than twice as high.
West Sussex, ranked
| District | Claimants, August 2026 | Rate |
|---|---|---|
| Horsham | 1,750 | 2.0% |
| Mid Sussex | 2,025 | 2.1% |
| Adur | 1,180 | 3.1% |
| Chichester | 2,365 | 3.2% |
| Worthing | 2,275 | 3.3% |
| Arun | 3,500 | 3.7% |
| Crawley | 3,705 | 4.6% |
Horsham and Mid Sussex are the only two districts in the county below three per cent. Both are well under the South East figure of 3.1 per cent and the United Kingdom’s 3.9.
The under-25 pattern has not gone away
We reported last month that the district’s youth claims were rising while older age groups fell. August did not change that.
- aged 16 to 24: 285 a year ago, 325 now, a rise of about 14 per cent
- aged 25 to 49: 950 a year ago, 965 now
- aged 50 and over: 480 a year ago, 460 now
At 325, under-25 claims are within five of their highest point in two years, reached in March and April. Under-25s are now 18.6 per cent of all claimants in the district, against 16.6 per cent a year ago.
The trend is national, but it is steeper here. Across the South East the 16 to 24 count went from 32,150 to 35,925 over the same twelve months, a rise of about 12 per cent. Across the United Kingdom it went from 312,115 to 343,395, about 10 per cent.
A caution on those age figures. The ONS does not publish a claimant rate broken down by age, so these are counts, not proportions of the young population. The under-25 count can rise partly because there are more young people, not only because more of them are claiming.
Of August’s claimants, 920 were men and 825 were women.
Where in the district
Ward figures for August 2026, ranked, with July for comparison.
| Ward | July 2026 | August 2026 |
|---|---|---|
| Denne | 190 | 200 |
| Billingshurst | 135 | 135 |
| Forest (Horsham) | 135 | 130 |
| Storrington & Washington | 115 | 115 |
| Colgate & Rusper | 100 | 105 |
| Roffey South | 90 | 105 |
| Pulborough, Coldwaltham & Amberley | 95 | 100 |
| Broadbridge Heath | 75 | 75 |
| Henfield | 75 | 75 |
| Roffey North | 70 | 75 |
| West Chiltington, Thakeham & Ashington | 75 | 75 |
| Southwater South & Shipley | 65 | 70 |
| Steyning & Ashurst | 65 | 70 |
| Bramber, Upper Beeding & Woodmancote | 60 | 65 |
| Holbrook West | 60 | 65 |
| Itchingfield, Slinfold & Warnham | 65 | 60 |
| Trafalgar | 50 | 60 |
| Holbrook East | 55 | 55 |
| Cowfold, Shermanbury & West Grinstead | 40 | 45 |
| Southwater North | 30 | 25 |
| Nuthurst & Lower Beeding | 25 | 20 |
| Rudgwick | 20 | 20 |
Roffey South rose most, up 15. Denne and Trafalgar each rose 10. Only four wards fell, and none by more than five. The figures are rounded to the nearest five, which is why the wards sum to 1,745 against a district total of 1,750.
A correction to our own figures
The claimant count is revised, and the most recent month is the one that moves.
When we reported the July figures on 25 August, the published district count for July was 1,725. The ONS now records July as 1,690, a cut of 35. The under-25 figure for July has come down from 310 to 300. So August’s 1,750 is a rise of 60 on the revised month.
This is not an error on anyone’s part. The Universal Credit part of the count “allows for revisions to the data for one previous month”, as the ONS sets out in its quality report on the claimant count. The same thing happened to the June figure in last month’s release. We flag it each time rather than quietly leaving the old number on the site.
What the claimant count is, and is not
It is not the unemployment rate. The ONS is explicit in its quality report that the count “does not attempt to measure unemployment, which is a concept defined by the International Labour Organisation”, and that it measures “the number of people claiming benefits principally for the reason of being unemployed, based on administrative data from the benefits system”.
Since Universal Credit, that includes people who are working but on low earnings and still required to look for more hours. So the figure is better read as a count of people the benefits system is pushing to find work, whether or not they have a job today.
What it means for you
At 2.0 per cent, roughly one working-age resident of the district in 50 is claiming, against about one in 26 across the United Kingdom. In absolute terms the labour market here is tight.
The exception is if you are under 25. On that measure the district has been getting steadily harder for two years, and August continued it.
The main route into support is Universal Credit, claimed online. Households on a low income can also apply for Council Tax Reduction, which Horsham District Council administers and which cuts the bill rather than paying out cash. Our guide to council tax bands in Horsham explains how that bill is worked out.
The August figures were published on 15 September. The September figures are due on 20 October. We will report them.
Have your say