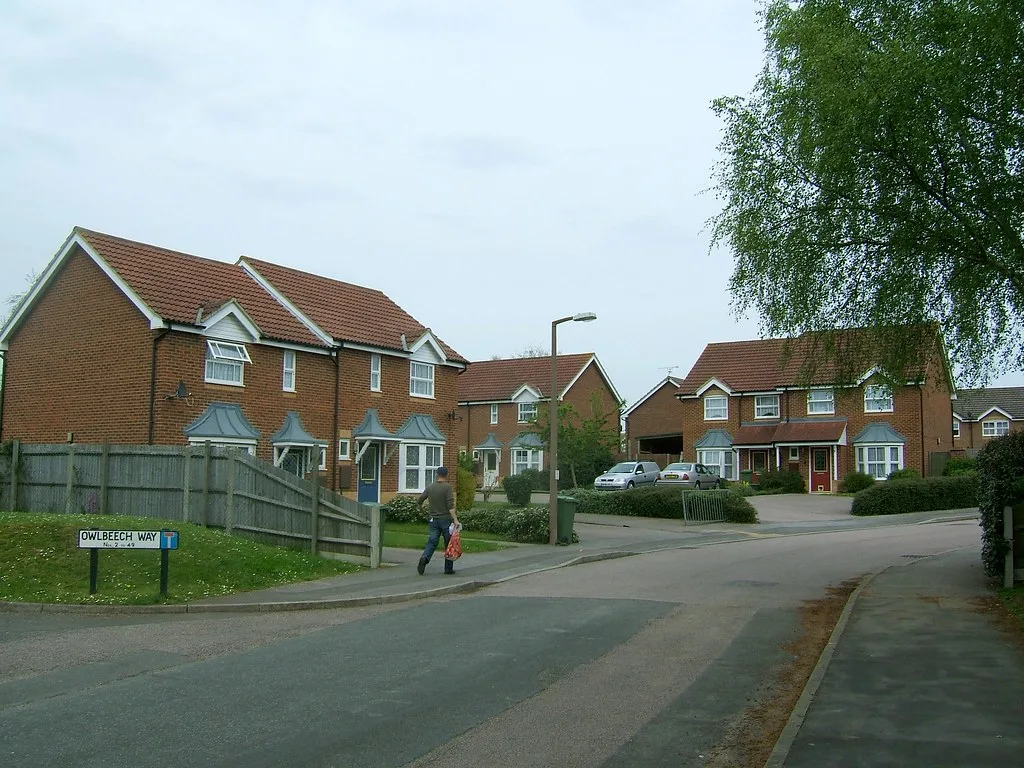

The average Horsham district home sold for £441,654 in July, up 0.7% on a year after June's fall. Semis rose 2.0%, flats fell 2.0%. Still top in West Sussex.
House prices in the Horsham district are rising again. The average home sold for £441,654 in July 2026, up 0.7% on July 2025. A month earlier the same measure was falling.
The figures come from HM Land Registry’s latest UK House Price Index (UKHPI, Horsham, July 2026). July’s average is £2,887 higher than a year before. It is also 1.1% up on June alone.
Back above zero after June’s dip
In our June report the district was 0.2% down on the year. That figure has since been revised to -0.3%, and June’s average to £436,790. July has now pulled the annual rate back above zero.
The annual rate through 2026, on the current figures:
- January: +4.6%
- February: +2.5%
- March: +2.0%
- April: -0.3%
- May: +1.1%
- June: -0.3%
- July: +0.7%
So the market has been flipping either side of zero since the spring, rather than sliding. January’s 4.6% still looks like the high point of the year.
For comparison, England rose 1.1% over the year to July and the South East 0.2% (UKHPI, England; South East). Horsham is now between the two.
Still the dearest in West Sussex
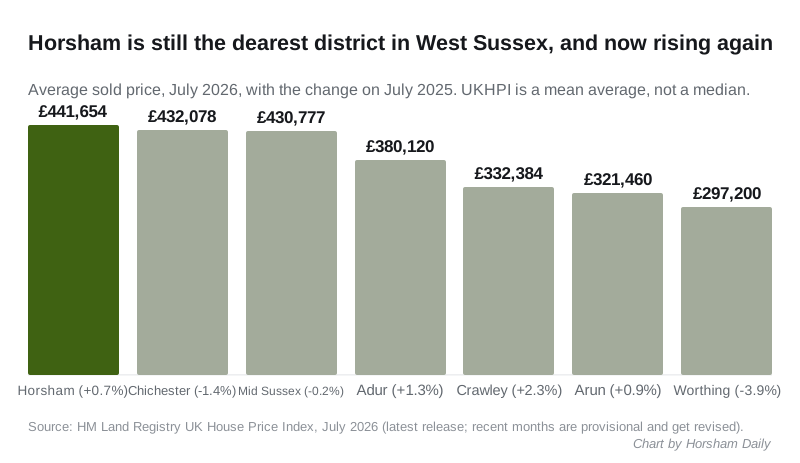
Average sold price in July 2026, with the change over twelve months:
| District | Average price | Change on a year |
|---|---|---|
| Horsham | £441,654 | +0.7% |
| Chichester | £432,078 | -1.4% |
| Mid Sussex | £430,777 | -0.2% |
| Adur | £380,120 | +1.3% |
| Crawley | £332,384 | +2.3% |
| Arun | £321,460 | +0.9% |
| Worthing | £297,200 | -3.9% |
West Sussex as a whole averaged £373,740, down 0.1% on the year (UKHPI, West Sussex).
Horsham has now opened a gap of almost £10,000 over Chichester, the next dearest. In June the two were about £4,400 apart. The difference is that Horsham rose over the year while Chichester and Mid Sussex both fell.
Crawley is still the county’s fastest riser, but it has cooled sharply. Its annual rate has dropped from 4.9% in June to 2.3% in July. Worthing is still the cheapest area and still falling fastest, at 3.9%.
Semis lead, flats still fall
Within the district, by property type:
- Semi-detached: £462,401, up 2.0%
- Terraced: £372,228, up 1.5%
- Detached: £765,698, up 0.6%
- Flats and maisonettes: £216,472, down 2.0%
Detached homes have turned round. In June they were 0.9% down on the year; now they are up. Flats are the only type still losing value, as they have been all summer, and that matches the county and England, where flats fell 3.0% and 3.5%.
A first-time buyer paid an average of £323,935, up 0.6%. Someone selling one home to buy another paid £557,223, up 0.7%. Cash buyers paid £466,778 and mortgage buyers £429,758.
Two health warnings
UKHPI is a mean, not a median. It is the arithmetic average of what sold, so a few big sales in a month pull it up. A single month’s jump of 1.1% can be a handful of expensive houses as much as a change in the market. It is not the price of a typical Horsham home.
The newest months get revised, sometimes a lot. Since our June report:
- January’s annual rate has moved from 4.3% to 4.6%
- May’s has moved from 0.8% to 1.1%
- April’s sales count has risen from 102 to 110, as late registrations arrived
Treat July’s figure as provisional. The index gives sales counts only to May so far: 146 in January, 130 in February, 167 in March, 110 in April and 127 in May. For comparison, it records 212 sales in July 2025.
What it means for you
If you are selling a semi or a terrace, these are the types that have held up best over the year. A detached house is now level-to-rising again. The district headline is still not a price for your home: check recent sales on your own street.
If you are buying a flat, prices are still edging down, by 2.0% over the year in the district. That is the one part of the Horsham market where time is on the buyer’s side at the moment.
If you are a first-time buyer, the average price you face rose by less than 1% in a year. Crawley, closer to Gatwick, is cheaper at £297,955 for a first-time buyer, but it rose faster, at 2.3% (UKHPI, Crawley).
None of this changes your council tax, which rests on a 1991 valuation. Our Horsham council tax bands page has the 2026/27 charges. The full picture by street and type is on our Horsham house prices page.
Sources
- UK House Price Index, Horsham district, July 2026, and June 2026, HM Land Registry
- UK House Price Index, West Sussex, July 2026, HM Land Registry
- District figures for Chichester, Mid Sussex, Adur, Crawley, Arun and Worthing, HM Land Registry
- England and South East, HM Land Registry
Have your say